XDebug Setup
XDebug Config
In order to use XDebug with docker you first need to define some XDebug config into the relevant service you want to debug. The sample config below shows how the XDebug config could look when it's added to your docker-composer.override.yml file.
Sample XDebug config (PHP 7.x)
version: '2.1'

services:

    sw0001:
        environment:
            # Enables XDebug
            XDEBUG: 1
            # Required config for XDebug to connect
            XDEBUG_CONFIG: idekey=PHPSTORM remote_host={{localMachineIP}} remote_enable=1
Sample XDebug config (PHP 8.x)
version: '2.1'

services:

    sw0001:
        environment:
            # Enables XDebug Step-Debugging
            XDEBUG_MODE: 'debug'
            # Required config for XDebug to connect
            XDEBUG_CONFIG: idekey=PHPSTORM client_host={{localMachineIP}}
Force recreation of the docker services with either the dev-cli s up, dev-cli w up sw0001 or docker-compose up -d ....
Intellij IDEA|PHPStorm Setup
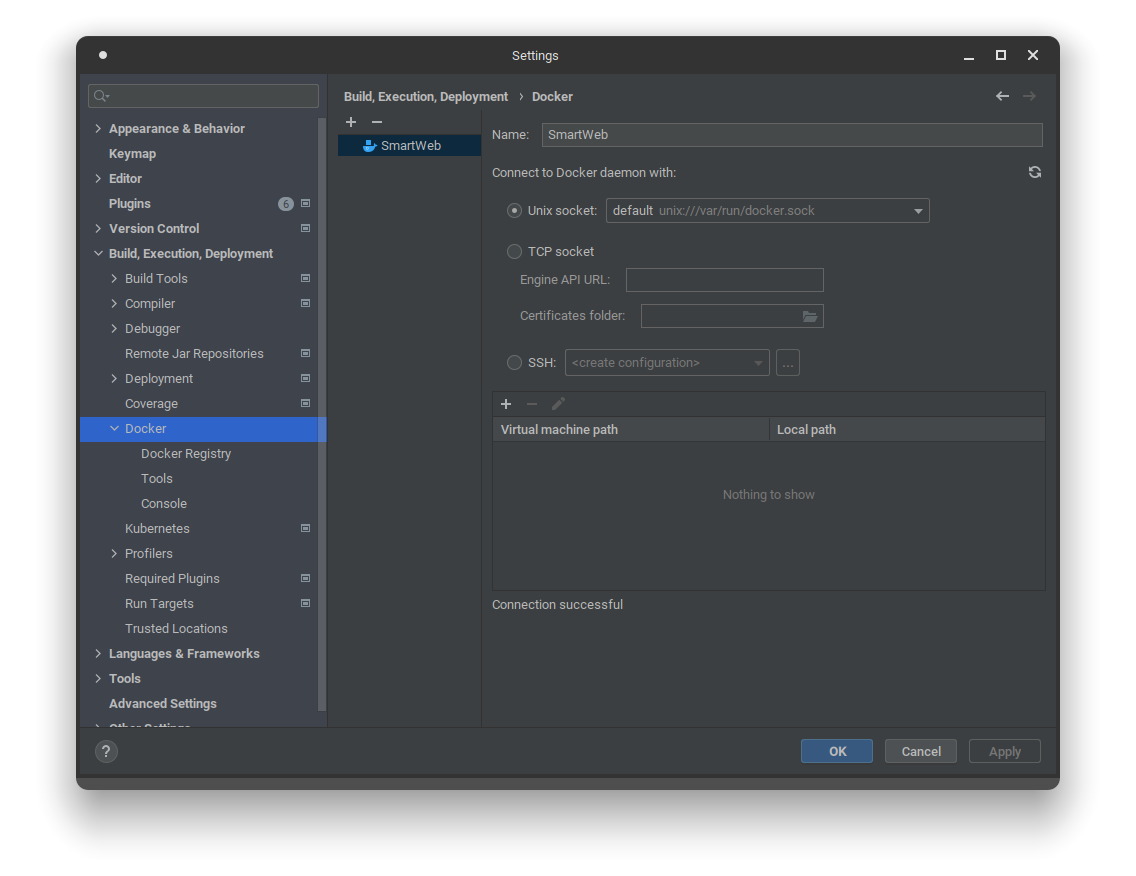
Ensure Docker is connected to your IDE
Navigate to: "Settings" > "Build, Execution, Deployment" > "Docker" and add a new Docker connection profile.
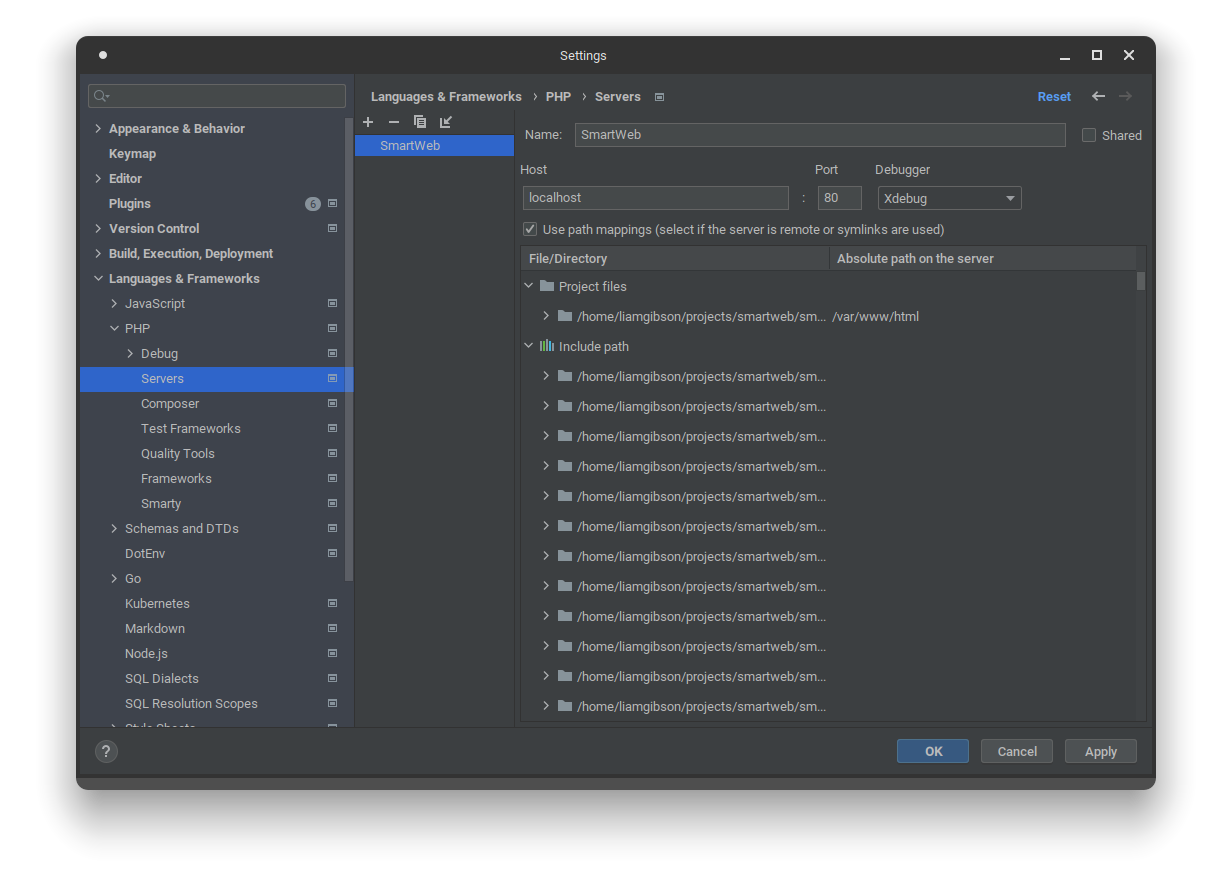
Navigate to: "Settings" > "Languages & Frameworks" > "PHP" > "Servers" and add a new server profile.
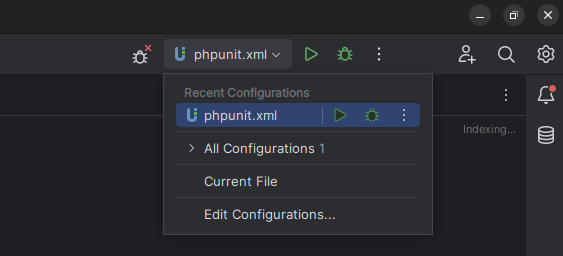
Navigate to XDebug Remote Debug configuration and create a new one via the "Execution Targets Toolbar Group" and select "Edit Configurations".
Execution Targets Toolbar Group:
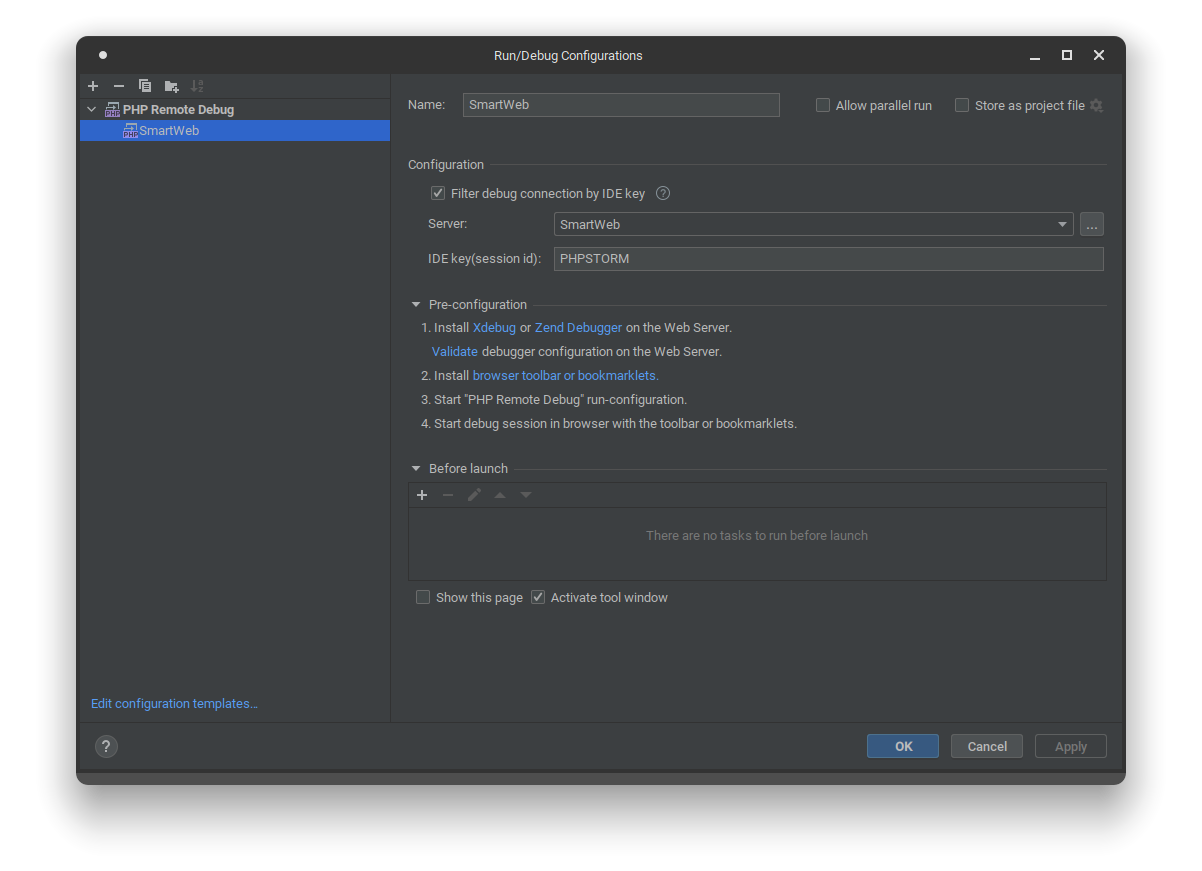
XDebug Remote Debug Configuration:
Debugging with XDebug
- Enable debug listening in your IDE.
- Install and enable the XDebug plugin for your browser and configure the correct IDE key in the options.
- Set a debug breakpoint and trigger the functionality to have the debugger pause execution for step debugging in your IDE.
Useful Information
How do I find my local machine's IP?
macOS
Windows with WSL
Linux (Debian based distributions like Ubuntu)